
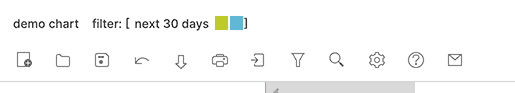
In the top title bar of the chart a summary of the active filter will be visible:
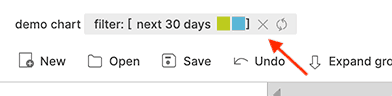
When you make changes to the chart (for instance change the color of a time block) you will always be able to see the changes you made (even if they don’t comply with the filter). To reapply a filter click on the reapply button in the filter panel or on the refresh icon in the filter summary in the title bar of the tool.
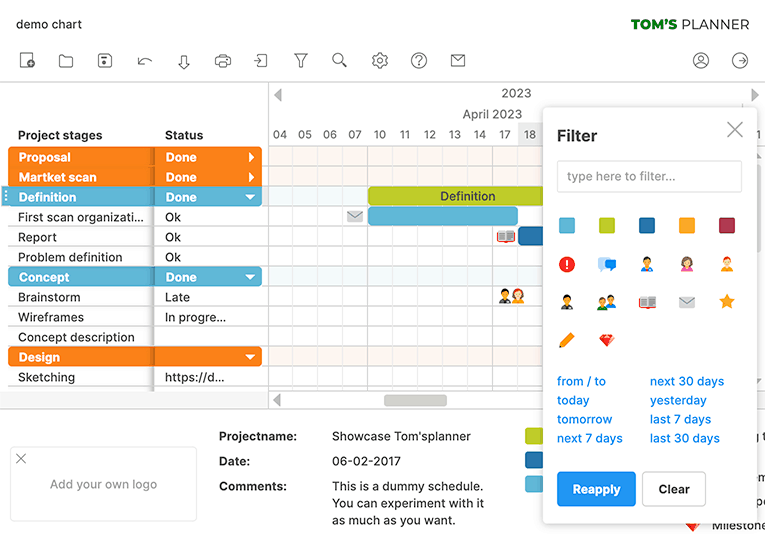
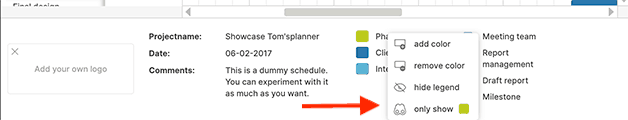
You can also filter by right clicking on elements in your legend:
Looking for something specific in your schedule? Just enter a text fragment (like for instance the last name of a resource) in the filter panel and only the related items in the chart will be shown.
Filters are part of the URL of the page that you are on. So if you bookmark a chart you will bookmark the filter settings as well.

Need more help with this?
Don’t hesitate to contact us here.